
How to Look Up Contra Costa County Jail Population Data
The Sheriff capacity and ADP FAQ is the primary local source for Contra Costa County jail population numbers. It posts rated capacity, average daily population, monthly bookings, and a description of the Custody Alternative caseload. Numbers update on the Sheriff schedule rather than in real time. State context lives at the Board of State and Community Corrections Jail Profile Survey. National jail context lives at the Bureau of Justice Statistics.
The Sheriff page also lists historical intake numbers. It reports 26,612 inmates booked in 2016, a monthly intake average of 2,218, and a daily intake average of 73. Those numbers describe flow, not stock. The ADP figures describe the stock of people in custody on a given day. Both views matter when reading Contra Costa County inmate population data.
Census QuickFacts at census.gov publishes the resident population denominator used for per-capita comparisons. The screenshot below shows the QuickFacts page for Contra Costa County, which is the standard source for the population base when computing jail rates per 100,000.
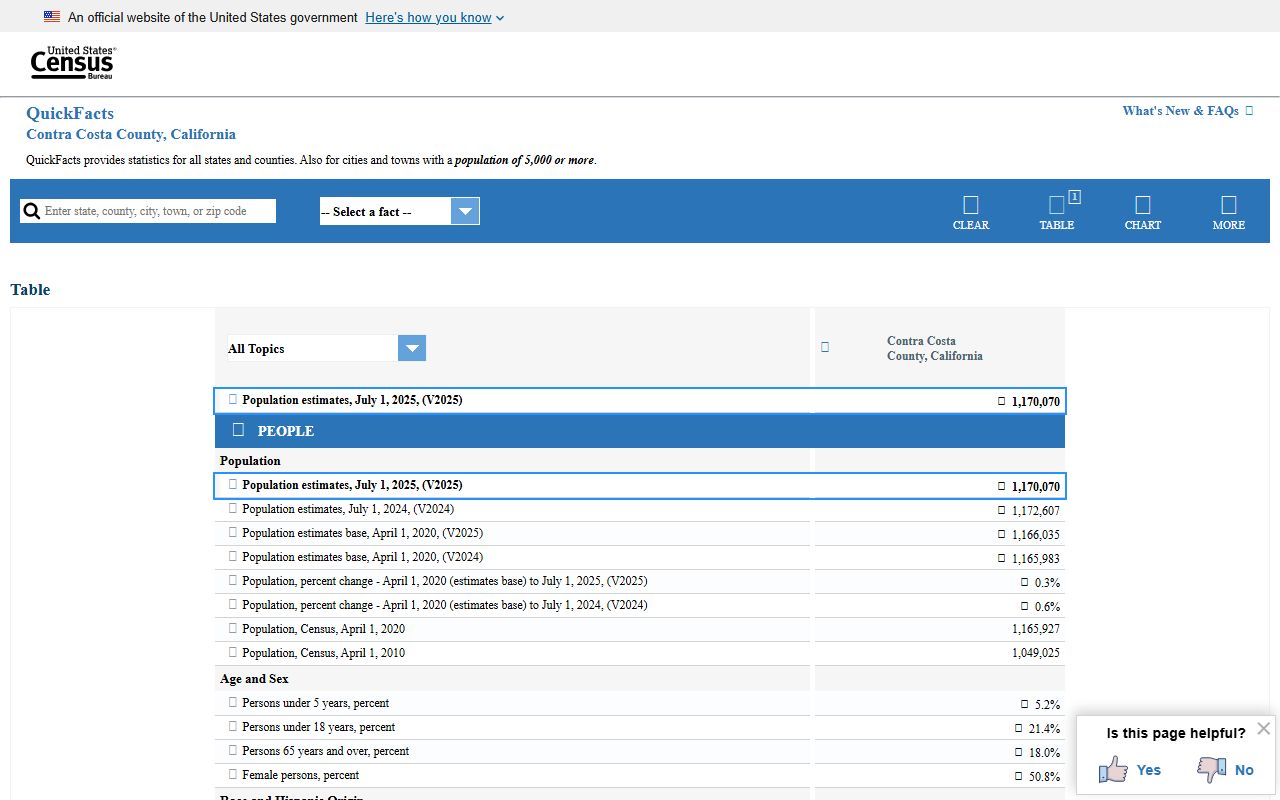
The QuickFacts denominator pairs with Sheriff ADP to compute a Contra Costa County jail population rate per 100,000 residents.
Contra Costa County Jail Capacity Overview
Three adult detention facilities make up the Contra Costa County jail system. Martinez Detention Facility is the pretrial intake hub. West County Detention Facility carries the largest rated capacity. Marsh Creek Detention Facility is the smallest, with lower-custody sentenced housing in East County. The Custody Alternative Facility supervises clients outside the walls and reduces physical custody counts.
| Facility | Rated Capacity | Average Daily Population |
|---|---|---|
| Martinez Detention Facility | 695 | 688 |
| West County Detention Facility | 1,096 | 764 |
| Marsh Creek Detention Facility | 188 | 68 |
| Total adult jail facilities | 1,979 | 1,520 |
Capacity utilization from those figures runs Martinez at about 99 percent, West County at about 70 percent, and Marsh Creek at about 36 percent. The total Contra Costa County inmate population sits at about 77 percent of rated capacity. Martinez is the pinch point; the Sheriff page calls it aging and overcrowded.
Average Daily Population
Contra Costa County jail ADP totals about 1,520 across the three facilities. Martinez Detention Facility runs at 688 ADP, West County Detention Facility at 764, and Marsh Creek Detention Facility at 68. Custody Alternative supervises an average of 425 clients on electronic home detention, work alternative, county parole, alcohol monitoring, or pretrial release. The Sheriff treats Custody Alternative as part of the broader custody picture even though those clients are not in a jail bed.
Year-over-year change tracks intake flow and release rate. The Sheriff did not publish a 2021 to 2026 annual ADP series in static pages located during research. Confirm year-over-year shifts from the BSCC Jail Profile Survey or county budget tables before publishing a trend line.
Demographic Breakdown
The Sheriff static pages did not publish a full Contra Costa County jail demographic table during research. Demographic variables to look for in BSCC reports and county budget materials include sex, age, race or ethnicity, average length of stay, mental health caseload, medical beds, federal holds, ICE detainees, and cost per inmate day. Do not invent demographic percentages; the official county numbers vary year to year and must come from the BSCC Jail Profile Survey or a Sheriff annual report.
The Prison Policy Initiative California profile gives state-level context and a system-level breakdown across jail, state prison, federal prison, juvenile, and civil detention. The image below shows the Prison Policy Initiative California profile, which is the cleanest free statewide demographic overview to pair with Contra Costa County jail data.
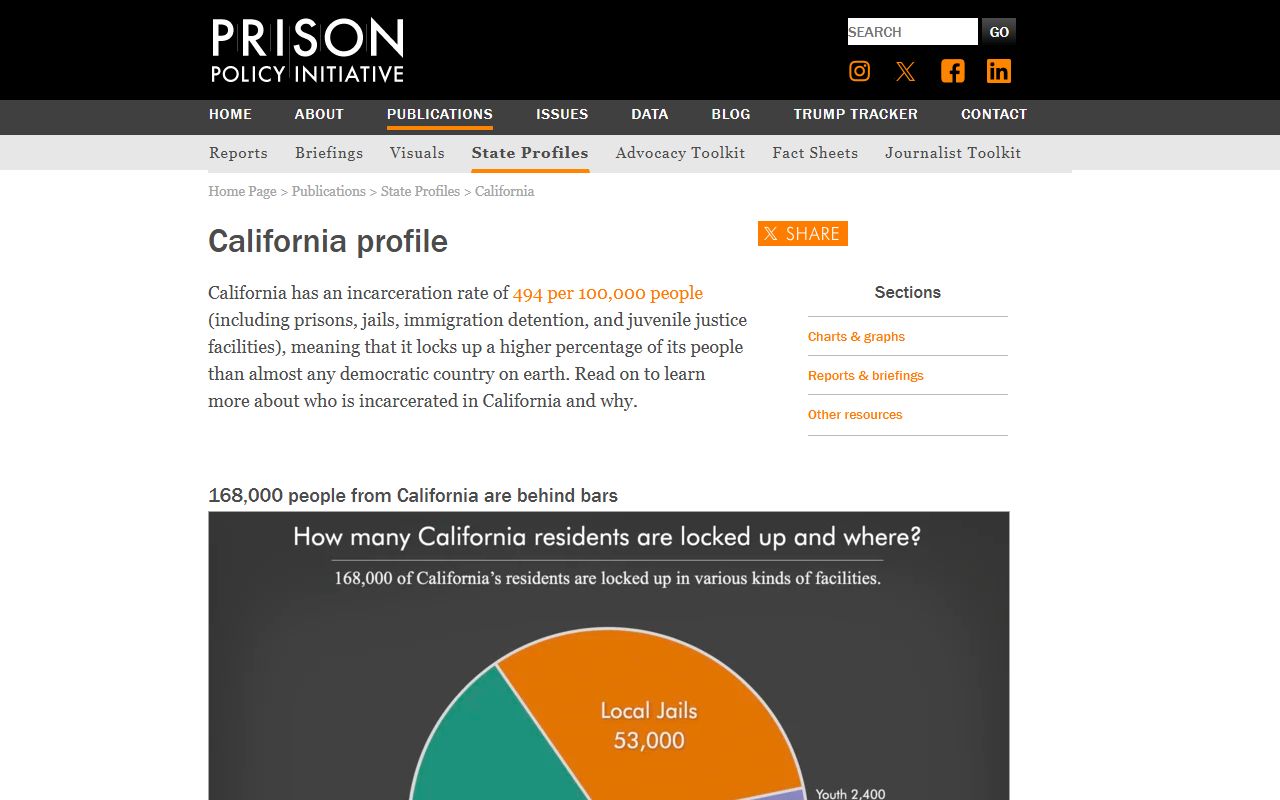
The Prison Policy Initiative page is statewide. Pair it with the Sheriff numbers above to read Contra Costa County jail demographic context.
Pretrial vs Sentenced Population
Contra Costa County jail data tracks a pretrial share and a sentenced share, but the Sheriff capacity page did not publish the current split in static text. BSCC Jail Profile Survey data and BJS Census of Jails publications cover the pretrial and sentenced split for California county jails. Pretrial means the person is held while a case is open; sentenced means the case is resolved and the person is serving local time.
Statewide California county jails commonly run more than half pretrial. Read the BSCC table for the exact Contra Costa County jail population pretrial percentage before publication. Sentenced housing tends to concentrate at West County Detention Facility and Marsh Creek Detention Facility, while Martinez Detention Facility leans pretrial.
Misdemeanor vs Felony Population
The Contra Costa County jail population mixes misdemeanor and felony cases. Felony cases dominate the pretrial stock at Martinez Detention Facility because felony bail tends to run higher and felony defendants tend to stay in custody longer. Misdemeanor cases turn over faster through citation release, own-recognizance release, and short sentences served at Marsh Creek or West County. Reading a clean misdemeanor versus felony split for the Contra Costa County jail population requires a Sheriff annual report or a BSCC pull.
Mental Health and Medical Population
The Sheriff capacity page describes proposed integrated housing, psychiatric, treatment, and reentry space at a new facility designed to move about 400 people out of the aging Martinez Detention Facility. That language signals a significant Contra Costa County jail mental health caseload, though the page does not publish a current percentage. Medical beds and mental health housing turn on classification screening at intake.
BJS Census of Jails data carries national mental health and medical population breakdowns. Pair it with county budget materials for an accurate read on the Contra Costa County jail population mental health and medical share. Do not infer county-specific numbers from national rates.
National and State Context
The Bureau of Justice Statistics publishes the federal benchmark on national jail populations and incarceration rates per 100,000. The screenshot below shows the BJS homepage, which is the right starting point for any national comparison to Contra Costa County jail population data.
BJS sits alongside the Vera Institute Incarceration Trends database and the Prison Policy Initiative California profile as the authoritative free context layer. A Contra Costa County jail population rate of about 142 per 100,000 (1,520 ADP across roughly 1.07 million residents per Census QuickFacts) sits below the national county jail average reported by BJS in recent years. Verify the current BJS national rate before publishing a specific number.
| Level | Approx Jail Population Per 100k |
|---|---|
| Contra Costa County | About 142 (1,520 ADP / 1.07M residents) |
| California statewide | Confirm via BSCC Jail Profile Survey and PPI California profile. |
| National county jail rate | Confirm via BJS Census of Jails latest report. |
Do not present a fixed national rate without checking the latest BJS release; jail populations changed sharply during the pandemic and again after.
Population Trends Over Time
Contra Costa County jail population trends from 2020 to 2026 track the same general arc as most California county jails. Populations dropped sharply during the early pandemic, then stabilized or rebounded as courts reopened. A current 2021 to 2026 annual Contra Costa trend report was not located in Sheriff static pages during research. The BSCC Jail Profile Survey publishes annual ADP figures by facility, and a county budget Public Protection chapter usually reports detention numbers.
The Sheriff page also describes a proposed integrated housing, psychiatric, treatment, and reentry services facility that would transfer about 400 people out of Martinez Detention Facility and dedicate space to programming and pre-release connections. If that project moves forward, the Contra Costa County jail population mix and Martinez utilization rate will shift.
Searching for Contra Costa County Inmate Records by Name
Aggregate Contra Costa County jail population data does not return a name-level result. For a name-based lookup of the live jail roster, use the Contra Costa County inmate records page, which walks through the Sheriff In-Custody Locator at Martinez, West County, and Marsh Creek.
Where the Contra Costa County Jail Population Data Comes From
The Contra Costa County Office of the Sheriff capacity and ADP FAQ is the primary local source. It posts rated capacity and average daily population per facility plus aggregate intake numbers. Sheriff David Livingston signs off on the public-facing material; headquarters sit at 1850 Muir Road, Martinez, CA 94553 with main office (925) 655-0000 and dispatch (925) 646-2441.
State context comes from the Board of State and Community Corrections Jail Profile Survey. The Bureau of Justice Statistics publishes the national jail census. The Prison Policy Initiative California profile packages the data into a single page. Vera Institute Incarceration Trends adds county-level history. The Contra Costa County Public Protection budget chapter and the Sheriff annual report (where published) add local color.
Read the source URL and date on every number used. Sheriff data, BSCC data, and BJS data each update on different cadences. A Contra Costa County jail population figure pulled from one feed in one year should not be combined with a figure from another feed in another year without a note.